DumbMonit
Alpha, for early testers Apache 2.0, no paid edition

Is everything fine? Know in one second.

Dumb-simple, self-hosted monitoring for homelabs and small teams. One container, one IP address to type in, useful graphs and alerts in under a minute.

$ mkdir dumbmonit && cd dumbmonit
$ curl -fsSLO https://raw.githubusercontent.com/noekan/dumbmonit/main/docker-compose.yml
$ docker compose up -d

Then open http://localhost:8080 and create the first account. Image for amd64 (arm64 later): ghcr.io/noekan/dumbmonit.

The DumbMonit pigeon, slate blue with googly eyes and an orange beak
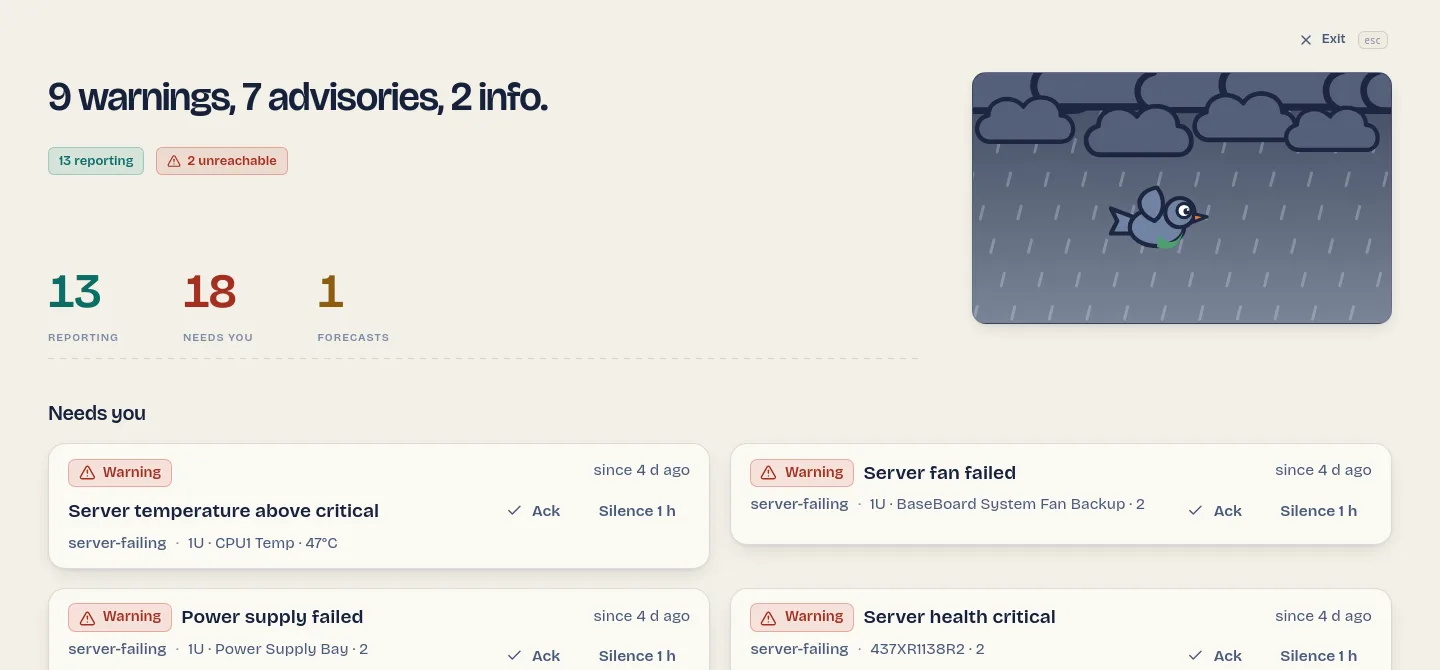
Wall mode: the sentence '9 warnings, 7 advisories, 2 info.', readouts for reporting devices, alerts and forecasts, a stormy weather window with the pigeon, and the alerts that need you
The bulletin, on the wall screen of a test instance with failures switched on. On a quiet day it reads “Clear skies.”

This is an alpha. DumbMonit runs every day on its author's own network, but the HTTP API is not frozen, the database schema still moves and there is no upgrade guarantee across schema changes yet. Several integrations have only met test instances, not years-old production hardware; they are marked below. Try it, and tell us what breaks.

One way to add anything

Pick a type, read the notice that says what to prepare on the device, fill in only the fields that type needs. SNMP profiles are picked from the device's sysObjectID; defaults do the rest.

Network and firewall

  • SNMP v1, v2c and v3Switches, routers, NAS, UPS, printers. Interfaces and errors, host resources, UPS battery, printer supplies; five profiles ship and apply themselves.
  • OPNsense Test instance onlyGateways with round-trip time and loss, the pf state table, VPN tunnels, DHCP leases, CARP, pending updates. Read-only API key.
  • Network discoverySweep a CIDR range and add everything that answers in one go.

Servers and hypervisors

  • Proxmox VENodes, VMs and containers, storage, HA, Ceph, ZFS, cluster quorum, and the age of the last backup of every guest.
  • Proxmox Datacenter Manager Test instance onlyWhich clusters and backup servers the console still reaches, the whole estate on one page, failed tasks on every site.
  • Server hardware (Redfish) Reference mockups onlyFans, temperatures against the hardware's own thresholds, power supplies and redundancy, drives, memory, the event log. Checked against the DMTF mockups, not yet a real iDRAC, iLO or Supermicro board.
  • Machines with the agentLinux and Windows, with macOS and FreeBSD in preview. More below.

Storage and backups

  • Proxmox Backup ServerA 30-day backup calendar per machine, failed tasks with their logs, verify and GC jobs, datastore fill-up forecast.
  • Synology DSMVolumes, pools, disks and SMART, temperature, Hyper Backup and Active Backup for Business with the age of the last success.
  • TrueNAS Test instance onlyThe pool that lost a disk and still serves data, with the disk named; scrubs, quotas, snapshots, replication, SMART.
  • Plakar backupsAge and result of the last snapshot per repository, through the agent.

Services and applications

  • Uptime checksHTTP(S) with status, keyword, JSON path and certificate; TCP port; DNS records; ping; TLS certificate expiry. History bar, response time, availability.
  • Application sessionsSMTP, PostgreSQL, MySQL and MariaDB, MQTT and WebSocket: a real login or handshake, so “up but refusing you” is not reported as “up”.
  • HeartbeatsA cron job or backup script calls a secret URL; when it stops calling, you hear about it. Uptime Kuma push-compatible.
  • Docker containersState, health, restarts, image age and available updates, through the agent. Opt-in restart and update inside a maintenance window.
  • Proxmox Mail Gateway Test instance onlyPostfix queues and the oldest stuck message, mail filtered today, quarantine sizes, the age of antivirus and antispam signatures.
Used on real devices Test instance onlyBuilt and checked against a real copy of the software installed for the purpose, not yet run for weeks in production

Every kind has its own page in the device documentation, with exactly what it reads and what to prepare. A demo device kind produces data without any hardware.

Alerts without the noise

Useful rules are on right after install. The work goes into sending fewer, better messages.

  • Dependencies

    Declare a switch as the parent of what sits behind it. When it goes down you get one notification, not thirty; the others read “Suppressed by parent”.

  • Grouped by host

    A NAS whose array degrades sends one message per cycle, not one per disk. Reminders, escalation and acknowledgement (“I know, stop reminding me”) are built in.

  • Baselines that learn first

    Anomaly detection with no threshold to tune: 168 buckets, one per hour of the week. It stays silent for its first 14 days and only shows what it would have fired.

  • Forecasts

    “This filesystem will be full within four days” is listed as a forecast, apart from what is broken right now.

  • Maintenance and a notification policy

    One-off or weekly windows, hysteresis, flap hold, quiet hours, batching and an hourly cap, so a bad night does not become two hundred pushes.

How alerting works

Alerts page: firing alerts grouped under their host, each with a Warning or Advisory plate, Ack, Silence 1 h and Open device
Alerts, grouped by host. Severities read like a weather service: info, advisory, warning.

22 notification channels

Each one has a Test button and a setup page in the documentation.

  • Discord
  • Slack
  • Microsoft Teams
  • Telegram
  • Matrix
  • Mattermost
  • Rocket.Chat
  • Google Chat
  • Zulip
  • ntfy
  • Gotify
  • Pushover
  • Pushbullet
  • Bark
  • Apprise
  • Home Assistant
  • Email (SMTP)
  • Signal
  • Twilio SMS
  • PagerDuty
  • Opsgenie
  • Webhook

An agent for what does not speak SNMP

A small binary that pushes CPU, memory, disks, network, services and uptime to the server, plus temperatures, fans, SMART and ZFS pools where the machine exposes them. It calls the server, never the other way round: no port to open on the machine.

# the UI fills in the token for you
curl -sSL http://server:8080/install.sh | sh -s -- \
  --token=dmon_xxx --url=http://server:8080

A PowerShell script is served at /install.ps1 for Windows. The agent is also an image, ghcr.io/noekan/dumbmonit-agent.

  • LinuxSupportedx86_64 and aarch64, systemd or OpenRC. Docker containers and OS health (updates, pending reboot, failed units).
  • WindowsSupportedx86_64, installed as a Windows service. SMART through smartctl.
  • macOSPreviewlaunchd, Apple silicon and Intel; binaries attached to each release. Not yet run on real hardware.
  • FreeBSDPreviewrc.d, x86_64, ZFS pools. Not yet run on real hardware.
  • Remote sites, outbound only

    In relay mode an agent runs the server's probes (SNMP, Proxmox, HTTP…) from its own network, so a second house or a small office shows up in the same DumbMonit without a VPN. Monitor a remote site

Status pages for the people you serve

Public pages at /s/<name>: groups of services with 90 days of daily history, 30- and 90-day uptime, incident and maintenance announcements, email subscribers with double opt-in, RSS, badges for a README and a compact embed for an intranet.

Only the labels you choose leave the server. Device names, addresses and types never appear on the page, in a badge or in an email.

Status pages in the documentation

  • Wall mode

    The bulletin alone, full screen, for a room monitor. It keeps the screen awake.

  • Accounts

    Admin and viewer roles, optional TOTP second factor, an audit log, and single sign-on over OpenID Connect (Authentik, Authelia, Keycloak, Pocket ID…).

  • Plays well with what you run

    /metrics, /federate and a Prometheus-compatible endpoint let an existing Grafana read DumbMonit's data. A REST API with scoped tokens, and a built-in MCP server for AI assistants.

  • On a phone

    Read the state, acknowledge an alert, start a maintenance window. Installable on the home screen, deliberately without an offline mode: it never shows yesterday's state.

The bulletin on a phone: the sentence, readouts, the weather window with the pigeon, and the first alert that needs you
The same bulletin at phone width.

Small enough to forget it is there

One Rust binary with the web interface built in, the VictoriaMetrics time-series database started by that binary inside the same image, and SQLite for configuration. No database container, no message queue.

1Container, one volume
~130 MBRAM, measured on 15 devices
1Architecture: amd64 (arm64 later)
0Capabilities required
  • The memory figure is the whole container, time-series database included, on a small instance. The database's cache budget is 256 MB by default and can be raised for hundreds of hosts.
  • Runs as a non-root user on a read-only file system, with every capability dropped. Ping monitors work through a sysctl, not NET_RAW.
  • Credentials are encrypted at rest (AES-256-GCM). Backups are one file, encrypted with a passphrase you choose, restorable onto a fresh instance with a dry run first.
  • Already running VictoriaMetrics? Point DUMBMONIT_VM_URL at it and the embedded one is not started.

How it compares

DumbMonit is for people who watch ten machines and three switches. The established tools are excellent at what they do; here is where each one fits better.

Zabbix

Mature, proven on thousands of hosts, with a template for nearly everything, distributed proxies and long-term support releases. It also asks for a database server, a web front end and time to learn items, triggers and templates.

Choose Zabbix for large fleets or when you need that depth today. Choose DumbMonit when you want the one-second answer and can live with fewer integrations and a young project.

Prometheus and Grafana

The standard for metrics: a huge exporter ecosystem, PromQL and dashboards for anything, including your own applications. You assemble and maintain the stack yourself: Prometheus, Alertmanager, exporters, dashboards and rules.

DumbMonit ships that assembly already done, and exposes /metrics, /federate and a Prometheus-compatible endpoint, so the two can live side by side.

Uptime Kuma

A polished, very popular uptime monitor with more monitor types, more notification services and a larger community. It checks services from the outside; it does not read a switch's ports, a hypervisor's guests or a NAS's disks.

DumbMonit includes Kuma-style checks and push-compatible heartbeats, next to device metrics. If uptime checks are all you need, Uptime Kuma is the more mature choice.

Open source, all of it

Apache 2.0, dependencies included: CI fails on any dependency that is not under an OSI-approved licence. No feature is held back for a paid edition, because there is none.

This site has no analytics, no cookies and no third-party requests.

What is still moving

  • The HTTP API is not frozen and the database schema still changes between alphas.
  • OPNsense, TrueNAS, Proxmox Datacenter Manager and Mail Gateway need reports from real, long-running installs. Redfish needs a real management controller.
  • The macOS and FreeBSD agents need someone to run them on real hardware.
  • What gets built next is decided in the GitHub issues, and the changelog says what changed.